Creutzfeldt-Jakob Disease (CJD) Data
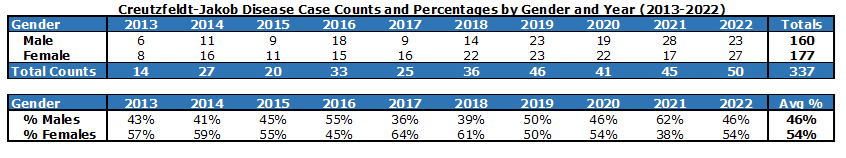
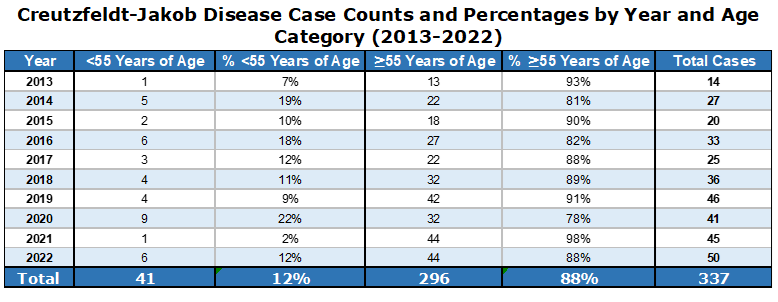
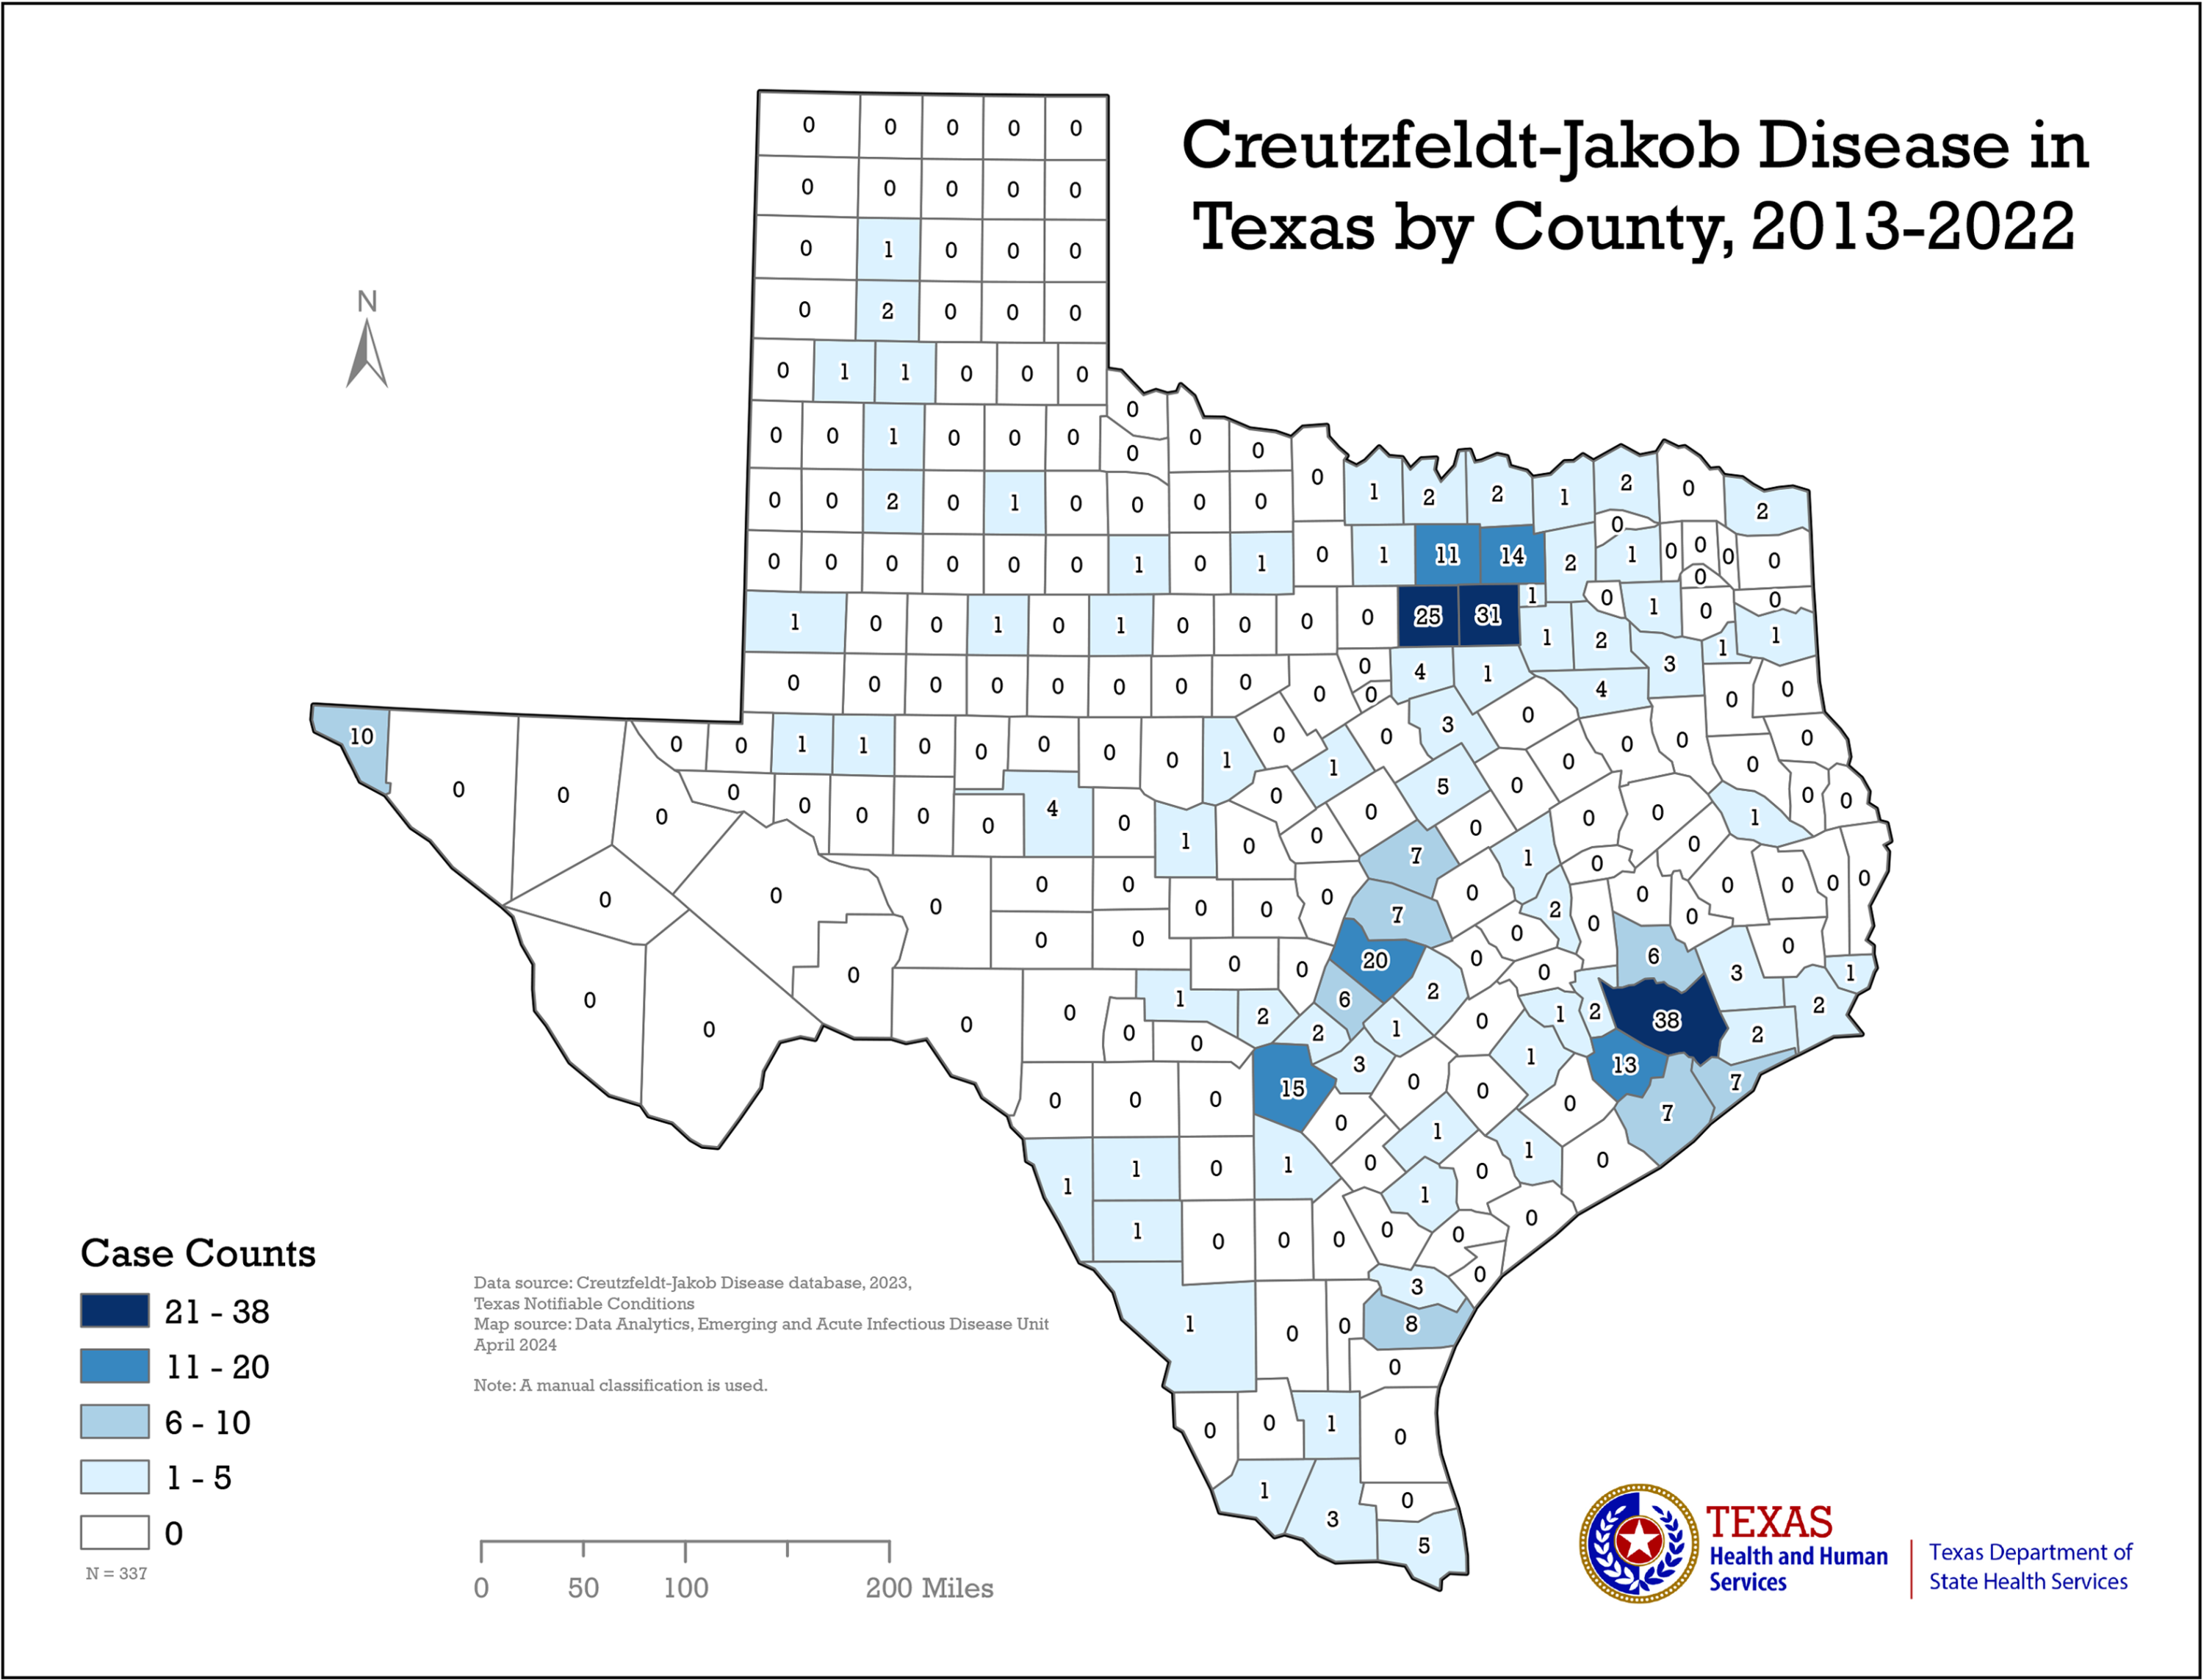
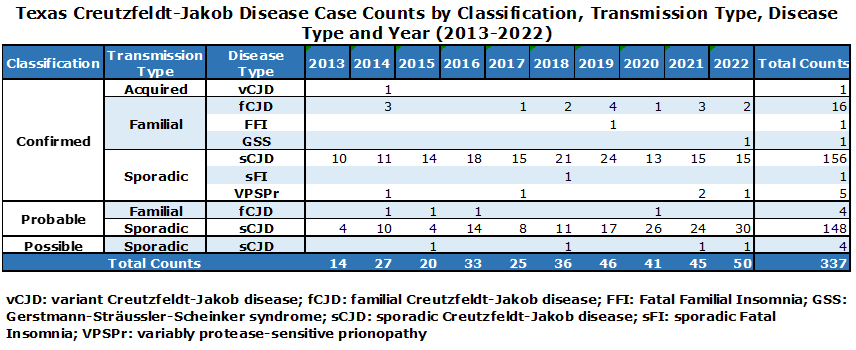
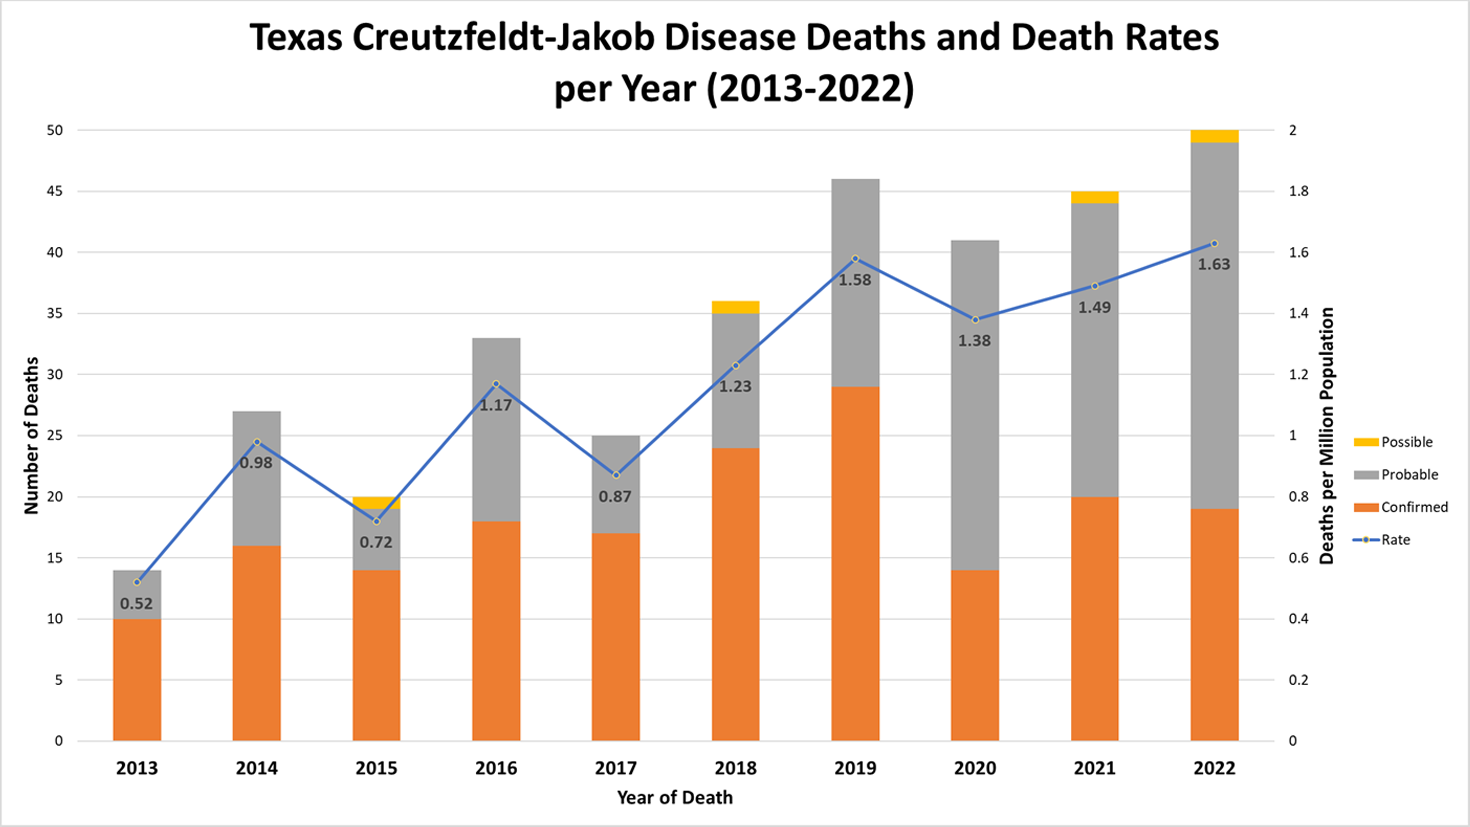
- The year a Creutzfeldt-Jakob disease (CJD) case is counted is based on the year of death.
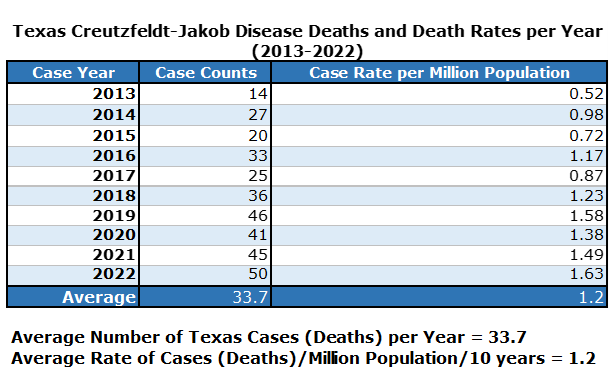
Classifi- cation |
Trans- mission Type |
Disease Type | 2012 | 2013 | 2014 | 2015 | 2016 | 2017 | 2018 | 2019 | 2020 | 2021 | Total Counts |
---|---|---|---|---|---|---|---|---|---|---|---|---|---|
Confirmed | Acquired | vCJD | 1 | 1 | |||||||||
Familial | fCJD | 3 | 1 | 2 | 4 | 1 | 3 | 14 | |||||
FFI | 1 | 1 | |||||||||||
Sporadic | sCJD | 10 | 10 | 11 | 14 | 18 | 15 | 21 | 24 | 13 | 15 | 151 | |
sFI | 1 | 1 | |||||||||||
VPSPr | 1 | 1 | 1 | 2 | 5 | ||||||||
Probable | Familial | fCJD | 1 | 1 | 1 | 1 | 1 | 5 | |||||
Sporadic | sCJD | 10 | 4 | 10 | 4 | 14 | 8 | 11 | 17 | 26 | 24 | 128 | |
Possible | Sporadic | sCJD | 1 | 1 | 1 | 3 | |||||||
Total Counts | 22 | 14 | 27 | 20 | 33 | 25 | 36 | 46 | 41 | 45 | 309 |
vCJD: variant Creutzfeldt-Jakob Disease; fCJD: familial Creutzfeldt-Jakob Disease; FFI: Fatal Familial Insomnia; sCJD: sporadic Creutzfeldt-Jakob Disease; sFI: sporadic Fatal Insomnia; VPSP: variably protease-sensitive prionopathy.
Case Year | Case Counts | Case Rate per Million Population |
---|---|---|
2012 | 22 | 0.83 |
2013 | 14 | 0.52 |
2014 | 27 | 0.98 |
2015 | 20 | 0.72 |
2016 | 33 | 1.17 |
2017 | 25 | 0.87 |
2018 | 36 | 1.23 |
2019 | 46 | 1.58 |
2020 | 41 | 1.38 |
2021 | 45 | 1.49 |
Average | 30.9 | 1.1 |
Average Number of Texas Cases (Deaths) per Year = 30.9
Average Rate of Cases (Deaths)/Million Population/10 years = 1.1
Population data for years 2012-2018 is from the Department of State Health Services, Center for Health Statistics. Population data for 2019-2021 is projected population from Texas Demographic Center’s Texas Populations Projections Program (https://demographics.texas.gov/data/tpepp/Projections/#srePop) and updated on July 18, 2019. For years 2012 (26,403,743), 2013 (26,932,619), 2014 (27,470,110), 2015 (27,695,284), 2016 (28,240,245), 2017 (28,797,290), 2018 (29,366,479), 2019 (29,193,268), 2020 (29,677,668), and 2021 (30,168,926), projected population was used.
Population data for years 2012-2018 is from the Department of State Health Services, Center for Health Statistics. Population data for 2019-2021 is projected population from Texas Demographic Center’s Texas Populations Projections Program (https://demographics.texas.gov/data/tpepp/Projections/#srePop) and updated on July 18, 2019. For years 2012 (26,403,743), 2013 (26,932,619), 2014 (27,470,110), 2015 (27,695,284), 2016 (28,240,245), 2017 (28,797,290), 2018 (29,366,479), 2019 (29,193,268), 2020 (29,677,668), and 2021 (30,168,926), projected population was used. |
Gender | 2012 | 2013 | 2014 | 2015 | 2016 | 2017 | 2018 | 2019 | 2020 | 2021 | Totals |
---|---|---|---|---|---|---|---|---|---|---|---|
Male | 12 | 6 | 11 | 9 | 18 | 9 | 14 | 23 | 19 | 28 | 149 |
Female | 10 | 8 | 16 | 11 | 15 | 16 | 22 | 23 | 22 | 17 | 160 |
Total Counts | 22 | 14 | 27 | 20 | 33 | 25 | 36 | 46 | 41 | 45 | 309 |
Gender | 2012 | 2013 | 2014 | 2015 | 2016 | 2017 | 2018 | 2019 | 2020 | 2021 | Avg % |
% Males | 55% | 43% | 41% | 45% | 55% | 36% | 39% | 50% | 46% | 62% | 47% |
% Females | 45% | 57% | 59% | 55% | 45% | 64% | 61% | 50% | 54% | 38% | 53% |
Year | <55 Years of Age | % <55 Years of Age | ≥ 55 Years of Age | % ≥ 55 Years of Age | Total Cases |
---|---|---|---|---|---|
2012 | 6 | 27% | 16 | 73% | 22 |
2013 | 1 | 7% | 13 | 93% | 14 |
2014 | 5 | 19% | 22 | 81% | 27 |
2015 | 2 | 10% | 18 | 90% | 20 |
2016 | 6 | 18% | 27 | 82% | 33 |
2017 | 3 | 12% | 22 | 88% | 25 |
2018 | 4 | 11% | 32 | 89% | 36 |
2019 | 4 | 9% | 42 | 91% | 46 |
2020 | 9 | 22% | 32 | 78% | 41 |
2021 | 1 | 2% | 44 | 98% | 45 |
Total | 41 | 13% | 268 | 87% | 309 |